Posterior Distributions
Posterior distributions of mortality schedules and life expectancies, for
states and microregions, by sex.
All links are to PDF files containing graphs.
In the Summary plots, each population (state or microregion) corresponds to
one of the horizontal bars that represent 80% posterior intervals for local life expectancy.
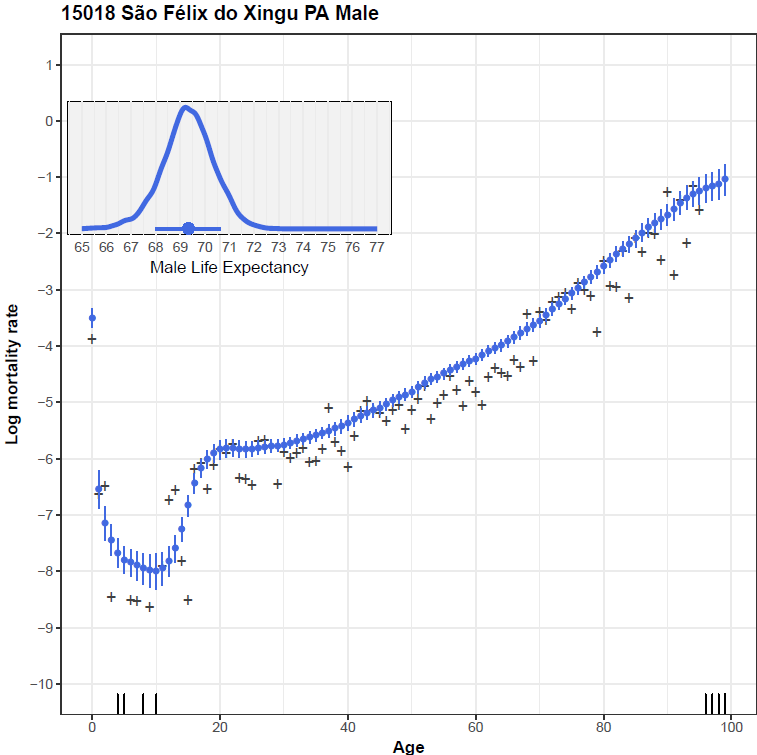
The Details plots -- as in the example on this page -- illustrate the
raw data (log of registered deaths/exposure by single
year of age), and the pointwise medians and 80% posterior intervals for
local age-specific mortality, and the posterior density of local life expectancy.
State-Level
Microregion-Level